Tuesday, November 28, 2017
Monday, November 20, 2017
Wednesday, November 15, 2017

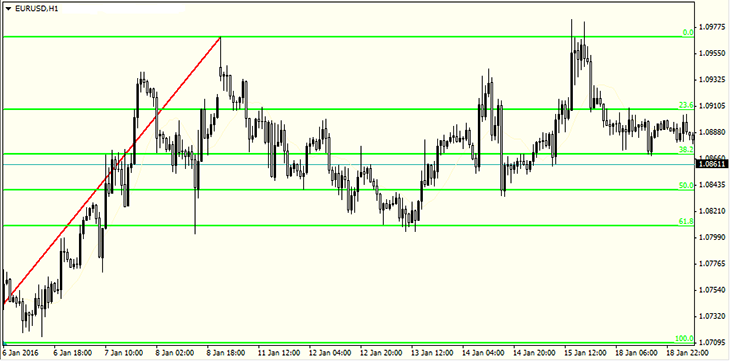
FIBONACCI RETRACEMENT LEVELS
Fibonacci levels are considered to be important and effective tools of technical analysis for determining the possible levels of trend reversal. By taking them into account the trader can determine the strong support and resistance levels, as well as the possible targets of correction and continuation trends.
Fibonacci Numbers
The Fibonacci sequence of numbers became popular in Europe thanks to an Italian mathematician Leonardo Pisano (Fibonacci), although, this sequence had been known in the East long before him. The sequence presents a series of numbers, where each subsequent number is the sum of the previous two: 3, 5, 8, 13, 21, 34, 55, etc. In addition, if any of the numbers of this sequence is divided into the following number, then the result will be approximately equal to 0.618, and if it is divided into the previous number, then the result will be 1,618. This sequence was used in the financial market by the famous trader Ralph Elliott. In his theory of waves, Ralph noticed that the ratio of the height of the next wave to the previous one is approximately equal to 1,618.
Fibonacci levels: How to use?
Practically, in any platform there is an instrument “Fibonacci Lines” with the help of which one can create correction levels - 0%, 23,6%, 38.2%, 50%, 61.8%, 76,4% and 100%. The Fibonacci lines also allow to determine the target of correction in case the trend continues – it is 161.8%, 261.8% and 423.6%. In case of an uptrend, the lines should be stretched from bottom to top, and in case of a downtrend – from top to bottom.
Trading on Fibonacci levels
Trading on Fibonacci levels involves the opening of a long positions in case of a rebound from the support line, when the market goes up, and the opening of a short position in case of a rebound from resistance level, when the market goes down.
Since Fibonacci levels are supposed to be support and resistance levels then trading based on these levels is conducted in the same way as in trading strategies based on support and resistance levels.
Monday, November 13, 2017
Wednesday, November 8, 2017

BEST CURRENCY TRADING INDICATORS
For forecasting the market and for minimizing the risks professional traders and investors use various tools. Among the well-known tools widely used by Forex traders for forecasting the market are technical indicators. With the help of technical indicators traders can easily decide when the right time is for them to buy or sell the financial instrument. Below are presented the best currency trading indicators that are widely used by professional Forex traders and technical analysts.
Best Currency Trading Indicators by Bill Williams
Bill Williams was a very popular and successful trader, who developed his own trading strategy, which was based on using a rational approach for analyzing the market and irrational logic of chaos. Due to his strategy developed the following indicators came into existence:
- Acceleration/Deceleration (AC) technical indicator
- Alligator
- Awesome Oscillator (AO)
- Fractals
- Gator Oscillator (GO)
- Market Facilitation Index
Best Currency Trading Indicators: Oscillators
In technical analysis oscillators express price changes over time. By their form oscillators are considered to be very advanced indicators, which are mainly used when the market is overbought or oversold. The market is overbought when the prices increase sharply and strongly and the market is oversold when the prices go down too much. Here are the most popular indicators:
- The Average True Range (ATR)
- The Bollinger Bands Indicator
- The Commodity Channel Index
- DeMarker Indicator
- The Envelopes Indicator
- The Force Index Indicator
- The Ichimoku Indicator
- Moving-Average Convergence/Divergence (MACD) Oscillator
- Momentum Oscillator
- Relative Vigor Index
- Relative Strength Index
- Stochastic Indicator
- Williams Percent Range (%R) Indicator
Here it would be worth mentioning about MACD histogram, which is again an important tool to signal the upward and downward momentums. An increasing histogram is used to signal upward momentum while a decreasing histogram indicates downward momentum.
Best Currency Trading Indicators: Trend
The next most important tool for making technical analysis is trend indicator which is used for indicating the direction of the price movements. Trend indicators are really a great help for traders as they help them to avoid many false signals and forecast the appearance of new trends in the market. Here are the most popular trend confirmation indicators:
- Average Directional Index (ADX) Indicator
- Moving Average Indicator
- Moving Average of Oscillator (OsMA)
- Parabolic Indicator
Best Currency Trading Indicators: Volume
Volume indicators are considered to be the main indicators of the market transactions. Volume indicators show the total volume of the orders during a certain time period. Here are the volume indicators:
- Accumulation/Distribution Indicator
- Money Flow Index (MFI) Indicator
- On-Balance Volume (OBV) Indicator
- Volume Indicator
Technical indicators are useful tools for traders. They make trading more structural and accurate.
IFC Markets is a leading innovative financial company, offering private and corporate investors wide set of trading and analytical tools. The company provides its clients with Forex and CFD trading through its own-generated trading platform NetTradeX, which is available on PC, iOS, Android and Windows Mobile. The company also offers MetaTrader 4 platform available on PC, Mac OS, iOS and Android. You may compare the advantages of both platforms.
Monday, November 6, 2017
Subscribe to:
Posts (Atom)