Wednesday, August 31, 2016

Prospect of rate hike lifts banking stocks

US stocks rose on Monday as investors adjust expectations for a rate hike this year. The dollar strengthened slightly: the live dollar index data indicate the ICE US Dollar Index, a measure of the dollar’s value against a basket of six major currencies, edged up 0.06% to 95.543. The Dow Jones industrial average closed 0.6% higher at 18502.99 led by Dupont,Travelers, American Express and JP Morgan shares, each up more than 1%. The S&P 500 ended 0.5% higher at 2180.38 led by 1% gain in energy stocks. The Nasdaq composite added 0.3% settling at 5232.33. Banking stocks rose on higher likelihood of a rate hike after Federal Reserve Chair Janet Yellen’s speech and Vice Chairman Fischer's comments at Jackson Hole, Wyoming. Yellen said on Friday an improving US economy had strengthened the case for a rate increase, with Fischer echoing by a bullish comment that Yellen’s speech was “consistent” with possibly two rate increases this year. Banking stocks tend to rise in higher rate environment on improved earnings prospects as the difference between rates they earn on loans and interest they pay out on deposits, known as net interest margins, rises when rates rise. The Fed funds futures market is now pricing in a nearly 50% chance of at least one hike by the end of 2016. In economic news the Personal Spending growth in July slowed to 0.3% from 0.5% in June while Personal Income Rose to 0.4% from 0.3%, in line with expectations. Inflation was unchanged in July with the PCE index, the Federal Reserve’s preferred inflation gauge, increasing 0.8% in the 12 months ended in July against 0.8% in June, while the annual rate of core PCE inflation was flat at 1.6% below the Fed’s 2% target. Today at 15:00 CET S&P/Case-Shiller Home Price Index for June will be released. The tentative outlook is negative for dollar. At 16:00 CET Conference Board Consumer Confidence for August will be published, the outlook is negative.
European stocks closed lower on Monday with expected tightening of US monetary policy weighing on market indexes. The euro and Pound ended lower against the dollar. The Stoxx Europe 600 closed 0.2% lower. Shares of oil companies slid as oil prices fell: Repsol dropped 1.3%, Eni lost 1% and Total was 0.9% lower. Germany’s DAX 30 lost 0.4% settling at 10544.44, France’s CAC 40 also closed down 0.4% at 4424.25. UK markets were closed for a local bank holiday. Today at 14:00 CET preliminary August consumer price index will be released in Germany, the outlook is negative for euro.
Asian stocks are rising today with Chinese stocks following banking stocks’ lead ahead of earnings reports from major banks: Shanghai Composite Index is 0.2% higher and Hong Kong’s Hang Seng index is 1% up, while Australia’s All Ordinaries Index gained 0.2%. Nikkei ended 0.07% lower today at 16725.36 as the pace of yen weakening against the dollar slowed after sharp yen depreciation on Friday follwoing Fed Chair Yellen’s speech. Market reaction to better than expected unemployment and retail sales reports was muted.
Oil futures prices are extending losses today on lower expectations that major crude producers may come to an agreement to freeze output at a meeting in late September. October Brent crude fell 1.3% to $49.26 a barrel on London’s ICE Futures exchange on Monday.

Monday, August 29, 2016

Investors cut net long dollar bets ahead of Jackson Hole symposium

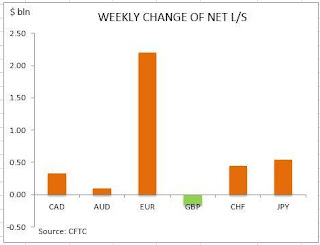
US dollar bullish bets fall to $6.35 billion from $9.80 billion against the major currencies during the previous week, according to the report of the Commodity Futures Trading Commission (CFTC) covering data up to July August 23. Economic data released during the week were mixed which didn’t contribute to dollar’s strength as the prospect of interest rate hikes remained uncertain. The Federal Open Market Committee July 26-27 meeting minutes showed two Fed officials argued for a rate hike but many policy makers wanted to wait for additional information. With recent data indicating no rise in inflation and weak wage growth, investors deemed the Federal Reserve will likely not hike rates at September meeting: Fed fund futures market data indicated market participants priced in an 18% chance of a September rate increase after the minutes were released, according to CME Group’s FedWatch tool. The jump in new home sales to 12.4% in July , the highest level in nearly eight years, instead of an expected 2% decline was a welcome positive news which provided support to Fed officials’ recent bullish comments about continued strength of US economy. But investors remained unconvinced the central bank will move to raise interest rates soon even as Fed Vice Chairman Stanley Fischer supported dollar bulls’ case last Sunday saying inflation is within “hailing distance” of the Fed’s 2% target. Investors cut dollar net long bets to seven week low ahead Fed Chair Janet Yellen’s speech at Jackson Hole on August 26. As is evident from the Sentiment table, sentiment deteriorated only for British Pound. And Swiss franc joined the Japanese yen, Australian dollar, and Canadian dollar as the fourth major currency held net long against the US dollar.
The bearish euro sentiment improved significantly as the pace of decline in net short position in euro almost quadrupled compared with the previous week: net short position fell by $2.2bn to $10.8bn. Euro remains the largest held net short against the dollar as investors increased the gross longs by 2314 contracts and covered the shorts by 13536 contracts respectively. The British Pound sentiment deteriorated as Pound net short rose at roughly half the previous week’s pace by $0.15bn to $7.8 billion. The net short position in British Pound increased as investors cut the gross longs by 40 contracts and the shorts were increased by 700. The bullish Japanese yen sentiment further intensified with the net long position in Japanese yen rising at roughly half the previous week’s pace by $0.5bn to $7.5bn. Investors increased the gross longs as they covered shorts by 2114 and 2196 contracts respectively.
The sentiment improved for the Canadian dollar with the net longs rising by $0.3bn to $1.29 billion. Investors increased the gross longs and cut gross shorts. The bullish sentiment remained strong for the Australian dollar with net longs rising by just $93 million to $3.2 billion. Investors continued to build the gross longs as they built also the shorts. The sentiment improved for the Swiss franc as a considerable weekly build of long bets of $0.4bn turned the $201 million net short position into a net long of $245 million. Investors increased the gross longs as they covered the shorts.


Friday, August 26, 2016


Awaiting keynote speech by Janet Yellen

26/8/2016

US stocks slid on Thursday due to the weak performance of healthcare and consumer sectors. On the other hand, financials were on the rise as two more Fed members supported the case for the Fed rate hike in order to prevent overheating of the US economy. US dollar index, a measure of a greenback’s value against a basket of six major currencies, fell 0.2% on Thursday to $94.765. S&P 500 index fell 0.13% to 2,172.61. Healthcare sector fell 0.79%. Dow Jones industrial average rose 0.17% to 18,449.98 while Nasdaq lost 0.11% to 5,212.20. Today on Friday markets are focused on Janet Yellen’s speech in course of the central bankers meeting in Wyoming as the Fed President may give clues on the interest rate hike timing and support the case for the second rate hike this year. At the moment, policymakers anticipate two rate hikes till the end of this year and three hikes in 2017. However, financial markets are more conservative and expect only one rate hike till the end of 2017. There is still no clear evidence of what decision the policymakers will make in September as they are of mixed opinion while the economic data do not clarify the situation. Today at 14:30 CEST the advance goods trade balance for Q2, personal consumption for Q2, annualized GDP for July and core personal consumption expenditure will come out. Today at 16:00 CEST the Fed Chair Janet Yellen will speak at Jackson Hole Policy Symposium. At 19:00 CEST the Baker Hughes rig count will be released.
European stocks are looking down today on poor performance of pharmaceuticals and ahead of Yellen speech later on today. EURUSD added 0.15% to $1.1283 despite the weak German Ifo indices that were released yesterday and showed that business confidence worsened. STOXX EUROPE 600 fell 0.2% on Friday, UK’s FTSE 100 lost 0.1% and Germany’s Dax 30 index fell 0.3%. The pharmaceuticals were the bottom performers as they lost 6.7%. Mining sector benefited from the rise in copper and zinc prices and added 1.5%. Glencore, Rio Tinto and Antofagasta stocks advanced 1.0%-2.3%. By the way, zinc prices reached a 15-month high. Today in the morning the UK’s preliminary GDP for Q2 came out neutral at 2.2%. Several other data in UK’s economy were also mainly positive. No more significant data is expected to come out today in Europe.
Asian stocks were mixed on Friday. Chinese stock market indices were barely flat on Friday as falling property shares erased the gains of other sectors. CSI 300 index lost 0.1% to 3,307.09 while Shanghai Composite Index advanced 0.1% to 3,070.31. For a week the indices fell 1.7% and 1.2% respectively. Meanwhile, Hong Kong stocks were on the rise on Friday as Hang Seng index added 0.4% to 22,909.54 led by energy and tech stocks. On the other hand, Japanese Nikkei slumped to 3-week low on Friday following retreating Wall Street and ahead of Fed Chair speech later on this day. The Nikkei index lost 1.2% to close at 16,360.71. Topix index fell 1.3% to 1,287.90.
Oil futures prices rebounded as markets expected the US dollar to lose ground before the Fed Chair speech. Brent crude rose 1.2% to $49.64 a barrel while WTI oil also added 1.2% to $47.33.
Gold is steady on Friday having hit a 4-week low a day before. Spot gold rose 0.1% to $1,323 an ounce.
Lower cotton stock expected

2016-17 global cotton ending stocks are estimated to fall due to lower beginning stocks and production, while US Department of agriculture projects higher domestic output. Will cotton continue rising?
Cotton: D1 has been rising since the end of February on the daily timeframe. The US Department of Agriculture August report World Agricultural Supply and Demand Estimate projects US cotton crop at 15.88 million bales, up 80000 bales from previous month’s estimate. The 2015 output was 12.89 million bales. This was a bearish news for cotton. Notwithstanding higher expected US output, 2016-17 global ending stocks are estimated to fall nearly 2% to 89.61 million bales due to lower beginning stocks and production. Currently the price is falling after hitting a 24 month high on August 5. It is still above the 200-day moving average MA(200), but has breached below the support of the uptrend.
At the same time the Parabolic indicator gives a buy signal.
The Donchian channel is tilted down indicating downtrend.
The RSI oscillator is edging lower and hasn’t reached the oversold zone yet.
The MACD indicator is below the signal line which is falling, and the gap with the signal line is widening. This is also a bearish signal.
We believe the bearish momentum will continue after the price closes below the last fractal low and lower Donchian boundary at 66.96. A pending order to sell can be placed below that level. The stop loss can be placed above the last fractal high at 70.16. After placing the order, the stop loss is to be moved every day to the next fractal high, following Parabolic signals. Thus, we are changing the probable profit/loss ratio to the breakeven point. The most risk-averse traders may switch to the 4-hour chart after the trade and place there a stop-loss moving it in the direction of the trade. If the price meets the stop loss level (70.16) without reaching the order(66.96) , we recommend cancelling the position: the market sustains internal changes which were not taken into account.
Technical Analysis Summary
Position Sell
Sell stop Below 66.96
Stop loss Above 70.16

Thursday, August 25, 2016

IFCMARKETS. Blog: Healthcare stocks drag US markets lowerUS stoc...

IFCMARKETS. Blog:


Healthcare stocks drag US markets lower
US stoc...
: Healthcare stocks drag US markets lower US stocks retreated on Wednesday led by health care stocks as lawmakers criticize Mylan fo...


Healthcare stocks drag US markets lower

US stocks retreated on Wednesday led by health care stocks as lawmakers criticize Mylan for raising the price of allergy drug EpiPens. The dollar strengthened as market participants await the comments of Fed Chair Janet Yellen at Federal Reserve’s summer symposium in Jackson Hole, Wyoming on Friday. Live dollar index data show the ICE US Dollar index, a measure of the dollar’s strength against a basket of six rival currencies, rose 0.26% to 94.749. The Dow Jones industrial average slipped 0.4% to 18481.48, with shares of UnitedHealth and Merck, each down more than 1%, pulling the blue chip index into negative territory. The S&P 500 closed 0.5% lower at 2175.44, led by 1.6% loss in health care stocks. Both the broad market index and the Dow closed at two week low. The Nasdaq composite index dropped 0.8% to 5217.69, the worst daily slump in three weeks. Economic news were also not supportive for higher risk appetite while investors refrained from making big bets ahead of Fed Chair Yellen’s speech. Markets expect Fed Chair will provide clues on timing of rate hikes this year. July sales of previously owned homes fell 3.2% to annual rate of 5.39 million, steeper than the expected decline of 1.1%. Investor will focus on Yellen’s speech tomorrow which may result in increased volatility. Today at 13:30 CET Initial Jobless Claims and Continuing Claims, and July Durable Goods Orders will be released in US. The tentative outlook is positive. At 15:45 CET advance Services and Composite PMIs for August will be released by Markit, the outlook is positive. At 16:30 CET Natural Gas Storage Change will be released by the Energy Information Administration. And Kansas City Fed Economic Symposium will start today at Jackson Hole, Wyoming.
European stocks advanced on Wednesday with financial shares leading the indexes while mining stocks slumped due to falling commodity prices. The euro weakened and the Pound edged higher against the dollar. The Stoxx Europe 600 rose 0.4%, the third winning session in a row. Shares of Commerzbank rallied 3.2% and UBS gained 2.9%. Shares of Glencore tumbled 3.1% after the mining giant reported a loss for the first half of the year. Germany’s DAX 30 index closed 0.3% higher at 10622.97. The final reading of second quarter German GDP confirmed the economy grew 0.4%, down from the 0.7% growth rate recorded in the first quarter. France’s CAC 40 gained 0.3% while UK’s FTSE 100 lost 0.5%. Today at 10:00 CET August Ifo Business Climate Index, Current Assessment and Expectations Indexes will be released in Germany. The tentative outlook is positive. At 12:00 CET August Retail Sales will be released in UK by the Confederation of British Industries. The tentative outlook is negative.
Asian stocks are lower today with Chinese stocks retreating after the central bank changed the supply of short term financing to cool investments in bonds and limit risks in the financial system. Hong Kong’s Hang Seng Index is up 0.1% while Shanghai Composite Index is down 0.5%. Australia’s S&P ASX 200 closed 0.36% lower as Australian dollar strengthened. Nikkei fell 0.2% in thin trading as the dollar remained above the 100 yen level.
Oil futures prices are extending losses today after the US Energy Information Administration reported Wednesday crude oil stocks rose by 2.5 million barrels to 523.6 million barrels, a level 16% higher than a year ago. October Brent crude fell 1.8% to $49.05 a barrel on London’s ICE Futures exchange on Wednesday.

Wednesday, August 24, 2016

IFCMARKETS. Blog: Equities advance on positive dataUS stocks advance...

IFCMARKETS. Blog: Equities advance on positive dataUS stocks advance...: Equities advance on positive data US stocks advanced on Tuesday as risk appetite was boosted by higher than expected new home sales data. Th...

IFCMARKETS. Blog: In this report we would like to present you anoth...

IFCMARKETS. Blog:
In this report we would like to present you anoth...
: In this report we would like to present you another trading instrument — oats. Russia, Canada and Australia are its major producers. Oa...
Equities advance on positive data

US stocks advanced on Tuesday as risk appetite was boosted by higher than expected new home sales data. The live dollar index data show the ICE US Dollar index, a measure of the dollar’s strength against a basket of six rival currencies, ended little changed at 94.494. The Dow Jones industrial average rose 0.1% to 18547.30 led by 1.6% and 1.1% rise in Nike and Cisco shares respectively. The S&P 500 advanced 0.2% to 2186.90 with eight out of ten main sectors closing in positive territory led by a 0.8% climb in materials shares. The Nasdaq index gained 0.3% to 5260.08, closing just about two points below of its all-time closing high of 5262.02 set on August 15. US new home sales jumped to the highest level in nearly eight years in July, rising 12.4% instead of expected 2% decline. The positive surprise was particularly welcome after disappointing retail sales report last Friday, spurring hopes strong consumption may boost economic growth while business investment is weakening. In other economic news flash manufacturing purchasing managers index from Markit came in weaker than expected, falling to 52.1 this month from 52.9 in July. Today at 13:00 CET Mortgage applications will be released by the Mortgage Bankers’ Associations in US. At 15:00 CET June House Price Index will be released by Federal Housing Finance Agency. The tentative outlook is positive. AT 16:00 CET July Existing Home Sales will be published. The tentative outlook is neutral.

European stocks extended gains on Tuesday supported by advances in mining and financial shares as well as strong economic data. . The euro weakened and British Pound strengthened against the dollar. The Stoxx Europe 600 index rose 0.9%. Mining giant BHP Billiton PLC was among top gainers as shares rallied 4.4% after a ratings upgrade to buy from hold by Jefferies investment bank. Higher preliminary composite purchasing managers index in euro-zone for August alleviated concerns that euro-zone’s economic recovery slowed after the UK vote in June to leave the European Union. Markit reported Composite PMI rose to 53.3 from 53.2 in July. A reading above 50 indicates an expansion. The manufacturing PMI declined to 51.8 in August from 52, but the Services PMI rose to 53.1 from 52.8 in July. Germany’s DAX 30 advanced 0.9% to 10592.88 helped by a 2.4% jump in Volkswagen shares after the German auto maker said it’s resolved a dispute with suppliers that led to a halt of parts deliveries. France’s CAC 40 gained 0.7% and UK’s FTSE 100 added 0.6% lower. Today second quarter final GDP came out unchanged at 0.4% over quarter in Germany. At 10:30 CET July Loans for House Purchases will be released by British Banker’s Association in UK. The tentative outlook is negative for Pound.

Asian stocks are mixed today with Chinese stocks retreating on diminishing expectations of further aggressive monetary easing after China's central bank injected cash into money markets through 14-day reverse repurchase agreements for the first time since February. Shanghai Composite Index is 0.13% lower and Hong Kong’s Hang Seng index is 1.2% down, while Australia’s All Ordinaries Index is up 0.11%. Nikkei ended 0.6% higher today at 16597.30 as yen weakened against the dollar lifting cyclical stocks.

Oil futures prices are edging lower today after the industry group American Petroleum Institute reported late Tuesday an increase of 4.5 million barrels in US crude stockpiles last week. Prices ended higher yesterday on speculation that Iran might cooperate with other global exporters to freeze output. October Brent crude rose 1.6% to $49.96 a barrel on London’s ICE Futures exchange on Tuesday. Today at 16:30 CET US Crude Oil Inventories will be released by the Energy Information Administration.

Gold is stable today as investors await Fed chair Janet Yellen’s speech at central bankers meeting in Jackson Hole, Wyoming on Friday August 26. The safe haven metal declined 0.1% on Tuesday on uncertainties surrounding interest rate hike timing.


In this report we would like to present you another trading instrument — oats. Russia, Canada and Australia are its major producers. Oats prices have been falling behind other grains recently. Will their prices continue advancing?

Oat is used to produce all-mash for livestock. Its price may depend not only other grain futures but also on beef and pork. Due to the relatively small volume of global oat market, there is no much data and news on this culture. We may emphasize that now oat is 17% cheaper than it was in early 2016 while corn is just 5% cheaper and wheat is 6% cheaper. The lean hog is being traded at around level of early January 2016.
Oats
On the daily chart Oats: D1 failed to fall below its 7-year low hit in early March and started correcting upwards. The MACD and Parabolic indicators give signals to buy. The Bollinger bands have widened a lot which means higher volatility. RSI has left the overbought zone and is below 50, no divergence. The bullish momentum may develop in case the oats surpass the last fractal high at 184. This level may serve the point of entry. The initial stop-loss may be placed below the Parabolic signal, the 7-year low and the last fractal low at 171. Having opened the pending order we shall move the stop to the next fractal low following the Parabolic and Bollinger signals. Thus, we are changing the probable profit/loss ratio to the breakeven point. The most risk-averse traders may switch to the 4-hour chart after the trade and place there a stop-loss moving it in the direction of the trade. If the price meets the stop-loss level at 171 without reaching the order at 184, we recommend cancelling the position: the market sustains internal changes which were not taken into account.
Position Buy
Buy stop above 184
Stop loss below 171

Market participants expect the Fed speech

Tuesday, August 23, 2016

All focus on Central Banks meeting in Jackson Haul next week


US stocks closed slightly higher on Thursday due to the gains in energy sector. Brent oil surpassed the level of $50 for the first time in 6 weeks which lifted up energy shares. Oil is being supported by the meeting of oil producers late in September where they are to discuss an output freeze. As a result, the energy index added 1.8%. Wal-Mart stocks were another driver of the markets as they surged 3.1% to more than a 14-month high. The company performed that well after the release of its quarterly earnings that managed to beat expectations. US dollar index, a measure of a greenback’s value against a basket of six major currencies, slid 0.6% to 94.077, almost a two-month low, after the Fed meeting minutes which gave additional support to dollar-denominated oil. S&P 500 rose 0.22% to 2,187.02 and is up 7% since the start of the year. The index has been advancing recently on expectations of the US Fed interest rate hike given the upbeat economic data. Dow Jones industrial average advanced 0.13% to 18,597.7. Nasdaq composite added 0.22% to 5,240.15. Telecommunications sector was among the bottom performers as it lost 0.8%. Cisco stocks fell 0.8% after announcement is planned massive job cuts. Data showed on Thursday that less Americans filed to unemployment benefits than it was expected. The trading volume on the US stock exchanges was lower with 5.9bn shares having changed hands with the 20-day average of 6.4bn shares. Today at 19:00 CEST the Baker Hughes oil rigs count will come out.
European stocks were on the rise on Thursday with pan-European STOXX 600 index adding 0.72%. Today on Friday the index slumped 0.6% as US dollar was looking down and mixed data were coming from Fed on possible rate hikes. The index has already lost 6.7% this year. All the main sectors were in the red on Friday with only energy sector outperforming as BP and Statoil shares advanced on rising oil prices. EURUSD fell 0.3% to $1.1325 up 1% this week.
Asian stocks were mixed on Friday. Japanese Nikkei closed higher on Friday as yen strengthening halted, but investors were cautious ahead of the meeting of the central bank chefs next week in Jackson Hole, US. The Nikkei index added 0.4% to 16,545.82 on Friday but failed to pair all the losses and closed the week 2.2% lower. USDJPY is traded at 100.15 after hitting a low of 99.55 on Tuesday. At the same time Hong Kong’s Hang Seng index fell 0.4% on Friday to 22,937.22 also cautious about the central banks meeting which may shed light on timing of interest rate hikes.
Oil futures prices were advancing with Brent crude having surpassed the level of $51. The oil prices were supported by cheaper US dollar as oil is denominated in dollars.
Gold was looking down on Friday as some hawkish comments from Fed renewed hopes on Fed rate hike this year. Still, there is no clear direction from the Fed, the last meeting minutes showed the Fed members were of mixed opinion on the rate hike. Spot gold fell 0.3% to $1,348.31 an ounce. Silver lost 0.6% to $19.61 an ounce while Platinum fell 0.2% to $1,123.
Vice Chair Fischer joins hawkish Fed officials

US stocks closed marginally lower on Monday as investors turned cautious ahead of Federal Reserve Chair Janet Yellen’s speech on Friday at Jackson Hole, Wyoming. The dollar strengthened on Fed Vice Chairman Stanley Fischer’s hawkish comments on Sunday. Fischer was optimistic about US economy’s short term outlook and said inflation is within “hailing distance” of the Fed’s 2% target. According to the live dollar index data the ICE US Dollar Index, a measure of the dollar’s value against a basket of six major currencies, added 0.08% to 94.51. The Dow Jones industrial average ended 0.1% lower at 18529.42 weighed by declines in Apple and Johnson & Johnson. Visa was the best performer among the blue chips. The S&P 500 slipped less than 0.1% to 2182.64 led by 0.9% decline in energy stocks as oil fell. At the same time the Nasdaq composite gained 0.1% to 5244.60. Fischer’s comments signaled that the central bank is considering raising rates soon despite the disappointing second quarter GDP report which led investors revise downward the likelihood of interest rate hikes. Fischer said that at 1.6% the core personal consumption expenditure, Fed’s preferred inflation benchmark, was “within hailing distance of 2%” and he expected that the GDP growth will pick up in coming quarters. Today at 15:45 CET preliminary August Manufacturing PMI will be released by Markit. The tentative outlook is positive. At 16:00 CET July New Home Sales and Richmond Fed’s Manufacturing Index for August will come out. The tentative outlook is negative.
European stocks closed slightly higher on Monday with losses in energy stocks weighing on market indexes. The euro ended lower against the dollar while the Pound edged higher. The Stoxx Europe 600 closed 0.1% higher helped by 11% jump in Syngenta shares after a US national-security regulator cleared the proposed $43 billion purchase of the Swiss seed maker by China National Chemical Corporation. Germany’s DAX 30 ended 0.5% lower at 10494.35, relinquishing earlier gains from advancing exporters which benefitted from improved prospects with lower euro but pulled back as euro pared losses. France’s CAC 40 closed down 0.2% and the UK’s FTSE 100 lost 0.4% to end at 6828.54. Today from 09:00 to 10:00 CET preliminary August Manufacturing, Services and Composite PMIs for France, Germany and euro-zone will be released by Markit. The tentative outlook is positive for euro. At 16:00CET preliminary August Consumer Confidence will be published in euro-zone, the outlook is neutral.
Asian stocks are mixed today with the yen adding to yesterday’s gains against the dollar. Chinese shares are edging higher with Shanghai Composite Index 0.19% up and Hong Kong’s Hang Seng index flat, while Australia’s All Ordinaries Index is up 0.62%. Nikkei ended 0.6% lower today at 16497.36 despite the first rise in manufacturing output in the last six months as indicated by slightly higher flash Manufacturing PMI at 49.6 in August after coming at 49.3 in July. Exporters were hurt by stronger yen.
Oil futures prices are extending losses today after prices settled sharply lower on Monday with crude oil output set to increase in Iraq and Nigeria while expectations for output freeze agreement between major oil producers faded. Production is expected to increase by roughly 150000 barrels a day from three oil fields in the Kirkuk region in Northern Iraq in coming weeks, and Nigeria can increase production by several thousand barrels a day after Niger militants announced an end to their attacks on foreign-owned oil infrastructure. October Brent crude fell 3.4% to $49.16 a barrel on London’s ICE Futures exchange on Monday.
Monday, August 22, 2016

IFCMARKETS. Blog: US dollar bullish bets fall on disappointing sales...

IFCMARKETS. Blog: US dollar bullish bets fall on disappointing sales...: US dollar bullish bets fall on disappointing sales and inflation reports Investors cut net long dollar bets to $9.8 billion from $11.31...
US dollar bullish bets fall on disappointing sales and inflation reports
Investors cut net long dollar bets to $9.8 billion from $11.31 billion against the major currencies during the previous week, according to the report of the Commodity Futures Trading Commission (CFTC) covering data up to July August 16. Recent economic data failed to alleviate concerns US economic recovery is slowing down. Following disappointing factory orders for June which showed factory orders accelerated declines, and data showing nonfarm productivity continued falling in the second quarter with services sector expansion slowing in July, July retail sales and inflation reports painted a picture of weakness for consumption and consumer prices too. Retail sales were flat in July compared with the previous month while headline inflation fell to 0.8% from 1.0% in June. Housing sector data also indicated housing starts slowed to 2.1% from 5.1% in June while building permits fell 0.1% after 1.5% rise in June. Falling inflation is the opposite of what Federal Reserve needs to justify raising interest rates, and inflation far below the 2% target rate Federal Reserve has identified as a threshold for hiking rates makes it unlikely the central bank will move to raise rates soon. The reports did little to address concerns US economic growth is slowing down after disappointing second quarter GDP data. Investors cut the bullish bets on US dollar. As is evident from the Sentiment table, sentiment deteriorated for British Pound, Canadian dollar and Swiss franc. And Japanese yen, Australian dollar and Canadian dollar remain the three major currencies still held net long against the US dollar.
The bearish euro sentiment improved as the net short position in euro fell $0.6bn to $13.0bn. The net short position in euro narrowed as investors increased the gross longs by 2618 contracts and covered the shorts by 3273 contracts respectively. The British Pound sentiment deteriorated further as the Pound net short rose by $0.36bn to $7.68 billion. The net short position in British Pound increased as investors built the gross longs by 367 contracts and the shorts were increased by 4523. The bullish Japanese yen sentiment further intensified with the net long position in Japanese yen rising at roughly the previous week’s pace by $0.98bn to $6.9 bn. Investors increased the gross longs and cut the shorts by 1554 and 5621 contracts respectively.
The sentiment continued to deteriorate for the Canadian dollar with the net longs declining by $0.20bn to $0.97 billion. Investors built both the gross shorts and gross longs. The bullish sentiment further intensified for the Australian dollar with net longs rising by $0.48bn to $2.67 billion. Investors continued to build the gross longs as they increased the shorts. The sentiment deteriorated again for the Swiss franc with the $14 million net long position turning into $201 million net short. Investors reduced the gross longs and increased the shorts.

Friday, August 19, 2016

All focus on Central Banks meeting in Jackson Haul next week

19/8/2016
US stocks closed slightly higher on Thursday due to the gains in energy sector. Brent oil surpassed the level of $50 for the first time in 6 weeks which lifted up energy shares. Oil is being supported by the meeting of oil producers late in September where they are to discuss an output freeze. As a result, the energy index added 1.8%. Wal-Mart stocks were another driver of the markets as they surged 3.1% to more than a 14-month high. The company performed that well after the release of its quarterly earnings that managed to beat expectations. US dollar index, a measure of a greenback’s value against a basket of six major currencies, slid 0.6% to 94.077, almost a two-month low, after the Fed meeting minutes which gave additional support to dollar-denominated oil. S&P 500 rose 0.22% to 2,187.02 and is up 7% since the start of the year. The index has been advancing recently on expectations of the US Fed interest rate hike given the upbeat economic data. Dow Jones industrial average advanced 0.13% to 18,597.7. Nasdaq composite added 0.22% to 5,240.15. Telecommunications sector was among the bottom performers as it lost 0.8%. Cisco stocks fell 0.8% after announcement is planned massive job cuts. Data showed on Thursday that less Americans filed to unemployment benefits than it was expected. The trading volume on the US stock exchanges was lower with 5.9bn shares having changed hands with the 20-day average of 6.4bn shares. Today at 19:00 CEST the Baker Hughes oil rigs count will come out.
European stocks were on the rise on Thursday with pan-European STOXX 600 index adding 0.72%. Today on Friday the index slumped 0.6% as US dollar was looking down and mixed data were coming from Fed on possible rate hikes. The index has already lost 6.7% this year. All the main sectors were in the red on Friday with only energy sector outperforming as BP and Statoil shares advanced on rising oil prices. EURUSD fell 0.3% to $1.1325 up 1% this week.
Asian stocks were mixed on Friday. Japanese Nikkei closed higher on Friday as yen strengthening halted, but investors were cautious ahead of the meeting of the central bank chefs next week in Jackson Hole, US. The Nikkei index added 0.4% to 16,545.82 on Friday but failed to pair all the losses and closed the week 2.2% lower. USDJPY is traded at 100.15 after hitting a low of 99.55 on Tuesday. At the same time Hong Kong’s Hang Seng index fell 0.4% on Friday to 22,937.22 also cautious about the central banks meeting which may shed light on timing of interest rate hikes.
Oil futures prices were advancing with Brent crude having surpassed the level of $51. The oil prices were supported by cheaper US dollar as oil is denominated in dollars.
Gold was looking down on Friday as some hawkish comments from Fed renewed hopes on Fed rate hike this year. Still, there is no clear direction from the Fed, the last meeting minutes showed the Fed members were of mixed opinion on the rate hike. Spot gold fell 0.3% to $1,348.31 an ounce. Silver lost 0.6% to $19.61 an ounce while Platinum fell 0.2% to $1,123.


New Zealand dollar strength endures

The New Zealand dollar has been strengthening since the end of January. The Reserve Bank of New Zealand cut the interest rates 0.25 percentage points to 2.0% at August 11 meeting and indicated further easing stance. Will the New Zealand dollar continue strengthening?
The Reserve Bank of New Zealand cut the Official Cash Rate by 25 basis points to 2.0% at its August 11 meeting. The central bank had left the rates unchanged at June and April meetings following an unexpected 0.25 percentage point cut in March after four rate cuts in 2015. The RBNZ stated it expects New Zealand’s economic growth will be supported by construction activity, tourism, strong inward migration and accommodative monetary policy while global economic outlook remained weak despite accommodative monetary policies in many countries. Low prices for exports, particularly for its major export concentrated milk, resulted in negative current account balances in the last three quarters of 2015 which turned to $1.3 billion surplus in the first quarter of 2016. Low export prices discourage business investment and growing migration restrains wage growth, both contributing to low inflation. Inflation in the second quarter rose to 0.4% from 0.2% in the first quarter, well below the central bank’s 1% to 3% target band. The central bank stated further policy easing will be required to ensure that future inflation settles near the middle of the target range. Recent labor market data indicated unemployment fell to 5.1% in the second quarter from 5.2% as labor force participation rate rose to 69.7% from 68.8%. At the same time retail sales grew 2.3% in the second quarter over the previous quarter, the highest rate in over five years. If sustained such a positive dynamic will be bullish for the kiwi dollar. On August 24 July balance of trade will be released and on August 31 July Australia and New Zealand Bank Business Confidence index for July will be published.
NZDUSD has been trading with upside bias since the end of January. The pair is retracing after pulling back from 19 month high following the central bank’s interest rate decision. It is above the 50-day moving average MA(50) which is rising above the 200-day moving average MA(200). The Parabolic indicator gives a buy signal. The Donchian channel is tilted upward indicating uptrend. The RSI oscillator is rising but hasn’t reached the overbought zone. The MACD indicator is above the signal line and the zero level which and the gap is rising which is also a bullish signal. We believe the bullish momentum will continue after the price closes above the last fractal high and upper Donchian channel at 0.7347. A pending order to buy can be placed above that level. The stop loss can be placed below the last fractal low at 0.7164. After placing the pending order the stop loss is to be moved every day to the next fractal low, following Parabolic signals. Thus, we are changing the probable profit/loss ratio to the breakeven point. If the price meets the stop loss level (0.7347) without reaching the order (0.7164), we recommend cancelling the position: the market sustains internal changes which were not taken into account.
Position Buy
Buy stop above 0.7347
Stop loss below 0.7167

Thursday, August 18, 2016


Gold vs Silver

Several central banks raise the share of gold in their forex reserves. For this reason, the gold prices may advance faster than silver. Let’s study the personal composite instrument (PCI) gold/silver, or XAU/XAG. Silver is the cheapest precious metal so it is far less suitable for state reserves formation than gold or platinum-group metals. Silver would require much more ample storage facilities. Will XAU/XAG advance?
Bank of China may be most keen on raisin gold share as since October 1, 2016 yuan becomes an IMF reserve currency. Now the gold accounts only for 2.1% of Chinese reserves in contrast to 60-70% in developed countries. In Q2 2016 the gold purchase rose in France, Britain, US, Canada, Vietnam and Iran. On the contrary, China purchased only around 120 tonnes which is the lowest in recent couple of years. Its purchases may rise in Q3. Forecasts say this year the global gold production is to contract by 2% compared to 2015 to slightly above 3 thousand tonnes. Since the start of the year gold prices have already advanced 27% while silver added 43%. In Q2 2016 gold rose 7% while silver added 19%. Such an outrunning growth leads to lower demand for silver in many countries. For instance, its imports to India fell.
XAU/XAG
On the daily chart XAU/XAG: D1 is fluctuating in a sideways range near the 2-year low. The MACD and Parabolic indicators have formed signals to buy. The Bollinger bands have narrowed a lot which means extremely low volatility. RSI has surpassed the level of 50 having formed positive divergence. The bullish momentum may develop in case the PCI surpasses the two last fractal highs and the upper boundary of sideways trend at 1.005. This level may serve the point of entry. The initial stop-loss may be placed below the Bollinger band and the lower boundary of sideways trend at 0.961. Having opened the pending order we shall move the stop to the next fractal low following the Parabolic and Bollinger signals. Thus, we are changing the probable profit/loss ratio to the breakeven point. The most risk-averse traders may switch to the 4-hour chart after the trade and place there a stop-loss moving it in the direction of the trade. If the price meets the stop-loss level at 0.961 without reaching the order at 1.005, we recommend cancelling the position: the market sustains internal changes which were not taken into account.
Position Buy
Buy stop above 1.005
Stop loss below 0.961

Copper is falling as global economy weakens

Copper prices are falling as global economic growth and industrial production are slowing down in many countries. Many traders note that copper has already twice tested its 200-day moving average but failed to break down thought it. They believe this level is key and if it is broken through the hedge funds may start selling copper futures. Will copper prices edge lower?
Stronger US dollar, if the Fed hikes the rates, may become additional negative for copper. Moreover, China raised the copper production by 9.6% this July compared to July 2015 to 722 thousand tonnes. Last week the net longs in copper at LME fell 5%. The gross longs are 115.2 while the gross shorts are 73.5. One lot accounts for 25 tonnes. China consumes about 45% of global copper so its economic data may have effect on copper prices. The next significant data, the manufacturing PMI, will be released in China only on September 1.
Copper
On the daily chart Copper: D1 is within the descending channel having tested already twice the 200-day moving average which is being the strong level of support. Theoretically, the fall may accelerate if the line is broken through. The MACD and Parabolic indicators have formed signals to sell. The Bollinger bands have narrowed a lot which means lower volatility. RSI is below 50 but has not yet reached the oversold zone, no divergence. The bearish momentum may develop in case the copper falls below the two last fractal lows and the Bollinger band at 2.13. This level may serve the point of entry. The initial stop-loss may be placed above the last fractal high and the line of the formed descending channel at 2 21. Having opened the pending order we shall move the stop to the next fractal high following the Parabolic and Bollinger signals. Thus, we are changing the probable profit/loss ratio to the breakeven point. The most risk-averse traders may switch to the 4-hour chart after the trade and place there a stop-loss moving it in the direction of the trade. If the price meets the stop-loss level at 2.21 without reaching the order at 2.13, we recommend cancelling the position: the market sustains internal changes which were not taken into account.
Position Sell
Sell stop below 2.13
Stop loss above 2.21

Tuesday, August 16, 2016

US equities hit record high

US stocks closed at record high on Monday as market sentiment was buoyed by the sharp rise in oil prices. The dollar weakened as mixed economic data pointed to lower likelihood of a rate hike this year. According to the live dollar index data the ICE US Dollar Index, a measure of the dollar’s value against a basket of six major currencies, slipped 0.11% to 95.586. The Dow Jones industrial average climbed 0.3% settling at a record high 18636.05 with DuPont and Goldman Sachs shares leading gains. The S&P 500 rose 0.3% to 2190.15 led by gains in materials, industrial, and energy stocks. Seven of ten main sectors advanced while utilities, consumer staples and telecom sectors ended lower. The Nasdaq composite gained 0.6% to finish at 5262.02, its third record closing high in a row. The Dow Jones industrial average, the S&P 500 index and the Nasdaq composite index all closed at record highs on Monday for the second time since 1999. Better than expected earnings reports are driving the markets higher despite recent weak economic data such as low economic growth in the second quarter and weaker-than-expected retail sales and wholesale prices in July. The S&P 500's earnings recession that began in the third quarter of 2015 is on track to end in the fourth quarter, with profits estimated to grow 8.3% in the fourth quarter. In economic news the manufacturing activity in the New York region declined in August as the Empire State manufacturing index fell to negative 4.2 from 0.6 in July. Deteriorating manufacturing conditions give more reason for the Federal Reserve to wait longer before raising interest rates. The CME Group’s FedWatch tool shows Fed funds futures are pricing in just a 9% chance of a Fed hike in September, down from nearly 20% at the beginning of August. At the same time the Housing Market Index, which is used as an indicator of single-family home builder confidence, rose more than expected in August, a positive sign for increased construction. Today at 14:30 CET July Housing Starts, Building Permits and Consumer Price Index will be released in US. The tentative outlook is negative for the dollar. At 15:15 CET August industrial production
will be released. The tentative outlook is negative.
European stocks closed slightly lower on Monday. The euro strengthened against the dollar while the Pound edged lower with further easing expected by the Bank of England. The Stoxx Europe 600 closed down less than 0.1%. Germany’s DAX 30 index closed 0.2% higher to 10739.21 as Volkswagen rose 1.1% after the auto maker said KBA, Germany’s federal motor transport authority approved technical fixes for 460000 vehicles with diesel engines. Market sentiment was supported also by German central bank’s announcement that Britain's vote to leave the European Union should have limited immediate economic impact on Germany. The DAX briefly turned positive for the year to date before closing to show a loss of less than 0.1% for the year. France’s CAC 40 closed down less than 0.1% to 4497.86, and the UK’s FTSE 100 rose 0.4% to end at 6941.19. Today at 10:30 CET July inflation will be published in UK, the tentative outlook is neutral for Pound. And at 11:00 CET August ZEW survey results for Germany and euro-zone will come out. The tentative outlook is positive for euro.
Asian stocks are edging lower today with yen advancing. Shanghai Composite Index is 0.47% lower while Hong Kong’s Hang Seng index is 0.01% up, and Australia’s All Ordinaries Index is down 0.14%. Nikkei ended 1.6% lower today at 16596.51 in thin trading as many investors were away for holidays. Toyota fell 1.26%, Honda lost 0.66% and Nissan dropped 1.73%.
Oil futures prices are rising today after prices settling sharply higher on Monday on expectations major producers may agree on production freeze at OPEC informal gathering late September. Russian Energy Minister Alexander Novak said yesterday Russia is consulting with the Saudis and other producers to jointly cap production “if necessary”. October Brent crude rose 2.9% to $48.35 a barrel on London’s ICE Futures exchange on Monday, the highest level since July 12.

Monday, August 15, 2016

US stocks continue rising

No significant economic data came out on Friday, but US stocks edged up and the dollar strengthened. Macy’s sales declined less than expected which pushed them up by 17%. Other two retailers Kohl's and J.C. Penney released their positive quarterly reports which contributed to the rise of their stocks by 16,2% and 8,6% respectively. "Rally" in the US stock market allowed the S&P 500 to rise by 7% compared to the opening of the year. Meanwhile, its current P/E ratio is 20, which is much higher than the the average level over 10 years, equal to 14. On Thursday, the US dollar index growth is mainly contributed by the statement of John Williams, the president of the Federal Reserve Bank of San Francisco, that a Federal Reserve rate hike could come at the end of the year. In his opinion, the improvement of US labor market and the possible increase in inflation can contribute to it. Today, at 14:30 CET, US retail sales for July and Producer Price Index will be released. Michigan Consumer Sentiment Index (MCSI) for August will be reported at 16:00 CET. Preliminary forecasts are neutral.
On Thursday, the European stocks renewed a 2-month high on good reporting of Symrise, GN Store Nord and Henkel. So far 80% from STOXX 600 have reported for the 2nd quarter. The earnings of 60% surpassed the preliminary forecasts. On Friday, the European market continued rising on good reporing of Maersk, as well as on the economic data of Germany. Comapred to the first quarter its GDP growth slowed in the second quarter, but it still surpassed the forecasts. At 11:00 СЕТ Eurozone GDP for the 2nd quarter and the industrial production will come out.
On Friday, Nikkei added more than 1%, while for the week it rose by 4,1%. It continues advancing the 7th straight day. Sharp Corp stocks jumped 20% after being acquired by Taiwanese company Foxconn. On Thursday, Japan had a day off for Mountain Day, so today the stock market was back to the good dynamics of world stock indices. Note that on Wednesday positive data on industrial orders and mortgages were released. Next week, Monday morning, important Japanese data will come out: the GDP for the 2nd quarter and the industrial production for June.
This morning, in Japan the data on industrial production and retail sales for July were released. They were slightly worse than expected. Investment indicators were also published, which showed minimal increase since 1999. This had a negative impact on a series of commodity futures and partly on the copper. Several market participants started to doubt that the easing of monetary policy could accelerate the growth of the Chinese economy.
Oil prices continue rising. In july 2016 its production in China reduced by 8,1% compared to the same month of last year, and has reached its lowest since October 2011 totaling 16,72mln tonnes or 3.94 barrels per day. Over 7 months 2016 oil output in China fell by 5,1% compared to the same period of 2015. Natural gas production decreased by 3.3% in July and by 3,1% over 7 monthes. Note that on Thursday oil prices jumped 4% after Khalid al-Falih, Saudi Arabia's energy minister, said that output freeze could occur.
Gold has slightly retraced as US dollar strengthened. Reuters published the results of its survey, according to which there is 72% probability that Fed will raise the rates to 0,5-0,75% from the current level 0,25-0,5%. By the end of 2017 it rose by 1-1,25%. Meanwhile, according to the current quarter data US GDP must rise by 2,5% annual rate and advance by 2% every quarter to the end of 2017. Inflation in the US should not exceed 2%.

Thursday, August 11, 2016


             US stocks grind higher

US stocks inched higher on Tuesday as weak productivity data capped the gains for market indexes. The dollar weakened as the unexpected fall in productivity was viewed as a negative development for a possible decision by Federal Reserve to raise rates later in the year. The live dollar index data show the ICE US Dollar index, a measure of the dollar’s strength against a basket of six rival currencies, slipped 0.24% to 96.101. The Dow Jones industrial average closed up less than 0.1% to 18533.00 led by Disney and Pfizer while a 0.7% declined in DuPont limited the gains. The S&P 500 added less than a point settling at 2181.74 with the gains in health-care and consumer-staples stocks offsetting losses in energy and materials sectors as oil prices fell. The Nasdaq index rose 0.2% to 5225.48, a record high. The 0.5% fall in labor productivity in the second quarter, the third straight quarterly decline, weighed on market sentiment. In other economic news wholesale inventories rose a revised 0.3% in June, up from the initial estimate of no change, and National Federation of Independent Business small-business index for July rose 0.1 point to 94.6, continuing a recent uptrend. Today at 13:00 CET Mortgage Applications will be released in US. At 16:00 CET Job Openings and Labor Turnover Summary results for June will be published. The tentative outlook is positive.
European stocks ended higher on Tuesday supported by positive earnings reports. The euro strengthened against the dollar while British Pound fell as data showed UK trade deficit widened in June and manufacturing output fell 0.3% while industrial production rose 0.1%. The Stoxx Europe 600 index rose 0.9%, the fifth winning session in a row. Energy shares were among best performing after crude oil prices rallied following the Organization of the Petroleum Exporting Countries statement on Monday it will hold an “informal” meeting in late September. Germany’s DAX 30 rallied 2.5% settling at 10692.90, entering into bull market territory defined as a rise of at least 20% from a recent low. The DAX hit its 2016 closing low of 8752.87 on February 11. France’s CAC 40 rose 1.2% and UK’s FTSE 100 gained 0.6%. No important economic data are expected in euro-zone today.
Asian stocks are retreating after hitting one year high today. MSCI's broadest index of Asia-Pacific shares excluding Japan rose 0.35% to the highest level since August 2015. Hong Kong’s Hang Seng Index is down 0.15% with Shanghai Composite Index down 0.21%. Australia’s S&P ASX 200 is down 0.15%. Nikkei ended 0.18% lower today as yen strengthened after weak US data and investors booked gains ahead of a Japanese holiday. Markets in Japan will be closed on Thursday for a public holiday, with some investors planning to take Friday off as well for a long weekend.
Oil futures prices are extending losses today after slipping the previous day as the support to prices due to a potential OPEC decision at a September meeting on measures to restore stability in the oil market failed to offset pressure from crude oversupply concerns. October Brent crude fell 0.9% to $44.94 a barrel on London’s ICE Futures exchange on Tuesday. At 16:30 CET today US Crude Oil Inventories will be released by the Energy Information Administration.
Gold is rising today as dollar retreats after weak US productivity data.

OPEC might restrain oil output

On Tuesday Brent prices rose for the 5th straight day amid the forecasts on reduction in US crude oil inventories by 0,95-1 million barrels and gasoline by 1,1 million. Official American inventory data will be released on Wednesday at 16-30 СЕТ. In addition, a possible extraordinary OPEC meeting could be called over the idea of coordinated oil-output action. Will oil prices continue falling?
OPEC President Dr Mohammed Bin Saleh Al-Sada said that the meeting might be held on the sidelines of the International Energy Forum in Algeria from 26 to 28 September 2016. Note that cartel's last official meeting took place on June 2. However, OPEC members failed to agree on oil production ceiling. The next meeting is set to take place on November 30. Venezuela, Ecuador and Kuwait have already agreed on an output freeze, while Iran and Iraq oppose the proposal. According to unofficial data, OPEC is trying to maintain global oil prices in the range of $50-60 per barrel which is higher than the current levels. Previously OPEC representatives said that low oil prices will not allow to make the necessary investments to maintain production. Note that Iran is the main opponent to the output freeze agreement. Lately the country's Oil Minister Bijan Zangeneh stated that in September the output volume would increase to 3.8-4 million barrels per day. Theoretically, no further increase will follow and Iran will support OPEC output restraint plans.
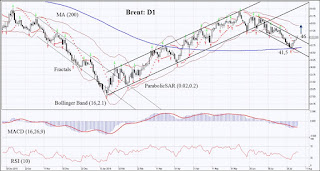
Brent
On the daily chart Brent: D1 failed to breach below the 200 – day moving average and left the downtrend. The MACD and Parabolic indicators have formed the signal to buy. The Bollinger bands have narrowed slightly which means lower volatility and their tilt has changed into horizontal. The RSI indicator is in the rising trend and below 50. No divergence. The bullish momentum may develop in case oil surpasses the Tuesday high and consolidates above the support of the downtrend at 46. This level may serve as a point of entry. The initial stop-loss may be placed below 200 – day moving average line and the last fractal low and Parabolic signal at 41,5. After opening the pending order we shall move the stop to the next fractal low following the Bollinger and Parabolic signals. Thus, we are changing the probable profit/loss ratio to the breakeven point. The most risk-averse traders may switch to the 4-hour chart after the trade and place there a stop-loss moving it in the direction of the trade. If the price meets the stop-loss level at 41,5 without reaching the order at 46, we recommend cancelling the position: the market sustains internal changes which were not taken into account.
Position Buy
Buy stop above 46
Stop loss below 41,5

Friday, August 5, 2016

Nasdaq index stock valuations are very high

On Monday the US high-tech stock index Nasdaq 100 updated its historical high in spite of the weak US GDP data for the second quarter. On Tuesday, the weak data on consumer spending came out and the index slightly declined. Will the US stock market correction happen?
The valuations of stocks of the US high-tech companies are much higher than the ones of the traditional economy corporations. The Р/Е ratio (current share price/earnings per share) for Nasdaq 100 index is 23. For the S&P 500 it is lower: 19,8. As a result, for instance, the online store Amazon equalled the oil giant Exxon Mobil in capitalization. The P/E ratio of Amazon reached 195, while for Exxon Mobil it is significantly lower: 29. It is difficult to say how justified are the high valuations of high-tech companies. Currently 353 corporations from S&P 500 components have reported earnings for the second quarter. On the basis of these data investors forecast a reduction of the total earnings of S&P 500 components by 2,6%. Market participants are now waiting for the release of labor market data for July on Friday. We do not exclude they may be negative despite the small increase in employment in the US based on the report of the independent agency ADP, published on Wednesday.
nd100
On the daily chart Nasdaq 100: D1 is inching lower from the upper bound of the uptrend. The MACD and Parabolic indicators have formed the signal to sell. The Bollinger bands have widened a lot which means higher volatility. The RSI indicator is in the overbought zone. No divergence. The bearish momentum may develop in case Nasdaq 100 index falls below Tuesday low: 4680. This level may serve as a point of entry. The initial stop-loss may be placed above the historical high, the last fractal high, as well as the Parabolic signal: 4770. After opening the pending order, we shall move the stop to the next fractal high following the Bollinger and Parabolic signals. Thus, we are changing the probable profit/loss ratio to the breakeven point. The most risk-averse traders may switch to the 4-hour chart after the trade and place there a stop-loss moving it in the direction of the trade. If the price meets the stop-loss level at 4770, without reaching the order at 4680, we recommend cancelling the position: the market sustains internal changes which were not taken into account.
Position Sell
Sell stop below 4680
Stop loss above 4770
Copper retreats on Chinese growth concerns

Copper has been declining since mid-July on slowing Chinese growth concerns. Recent data showed manufacturing sector contracted in June while growth in services sector slowed. Polls indicate industrial production and retail sales are expected to moderate in July. Will the copper continue declining?
Copper has been falling on concerns growth in China, world’s biggest consumer of copper, is slowing. The Caixin Services PMI declined to 51.7 in July from 52.7 in June as growth slowed in services sector and employment fell for the first time in four months. The Manufacturing PMI came in slightly below expectations at 49.9 compared to 50.0 in June, indicating a contraction in manufacturing sector as output and new orders declined and export orders fell further. China’s top planner called on Thursday for the central bank to cut interest rates and bank reserve requirements "at the appropriate time" in order to stimulate the economy. Growth in construction in recent months was the result of increased government spending on infrastructure projects which increased demand for metals. Recent poll by Reuters indicates urban fixed asset investment likely expanded 8.8% in January-July, a fresh 16-year low, declining from 9.0% in January-June. Further fiscal measures will be needed to boost growth in the remaining five months with private investment growth declining to record lows. As to supply, Rio Tinto confirmed it plans to expand copper output even after it reported a 47% slump in first-half profit to its weakest in 12 years. And Japan's Mitsui said the Caserones copper mine in Chile was currently running at around 80% utilization and the miner aimed to further improve its competitiveness. Rising supply as demand declines will put further downward pressure on copper. The fixed asset investment data together with the industrial production and retail sales for July will come out on Thursday, August 11 with the growth in industrial production and retail sales expected to moderate.
COPPER:D1 has been declining in daily timeframe since July 13 after hitting three month high following the external trade report which showed China's imports and exports fell in June. The price has breached below both the 200-day and 50-day moving averages MA(200) and MA(50). The Parabolic indicator still gives a buy signal. The Donchian channel is tilted downward, indicating downtrend. The MACD indicator is above the signal line and the gap is falling, which is a bearish signal. The RSI oscillator has crossed below the 50 level which is a bearish signal. We believe the bearish momentum will continue and we can go short right away. The stop loss can be placed below the last fractal high at 2.2501. After placing the order, the stop loss is to be moved every day to the next fractal high, following Parabolic signals. Thus, we are changing the probable profit/loss ratio to the breakeven point. The most risk-averse traders may switch to the 4-hour chart after the trade and place there a stop-loss moving it in the direction of the trade. If the price meets the stop loss level without reaching the order , we recommend cancelling the position: the market sustains internal changes which were not taken into account.
Position Sell
Sell limit below 2.163
Stop loss above 2.2501

Tuesday, August 2, 2016

Strong price increase may result in lower demand

With the advent of warm weather in late April of the current year, orange juice rose by 45%, and since the autumn of the last year – approximately twofold. This was caused by the drought in Brazil and by the reduction of orange crop in the states of São Paulo and Minas Gerais by 15%. There has been an improvement in weather conditions in recent days. Will the orange juice prices fall?
According to the US Department of Agriculture, orange juice reserves in the United States fell to 766 million pounds in June of the current year from 772 million pounds in May. The current level is nearly 20% less than the reserves in June of the last year. In this regard, orange juice price renewed the 4-year maximum last week. We deem that no significant negative news for orange juice is observed, but a number of agricultural agencies consider it "overvalued" in comparison with other non-alcoholic beverages. Let’s consider a trade in case of the beginning of orange juice price correction.
Orange
On the daily chart Orange: The price has stopped the uptrend on D1 and is moving sideways. On Monday, it rose slightly, bouncing off from the 1st Fibonacci level, which is close to the lower boundary of the short-term neutral range. The MACD and Parabolic indicators have formed the signal to sell. The Bollinger bands have contracted a lot which means lower volatility. The RSI indicator is close to 50 and has formed negative divergence. The bearish momentum may develop in case the orange juice falls below the 1st Fibonacci level and the Monday’s low at 174. This level may serve as an entry point. The initial stop-loss may be placed above the last fractal high and 4-year maximum, as well as the Bollinger bands and Parabolic signal at 195. After opening the pending order, we shall move the stop to the next fractal high following the Bollinger and Parabolic signals. Thus, we are changing the probable profit/loss ratio to the breakeven point. The most risk-averse traders may switch to the 4-hour chart after the trade and place there a stop-loss moving it in the direction of the trade. If the price meets the stop-loss level at 195 without reaching the order at 174, we recommend cancelling the position: the market sustains internal changes which were not taken into account.
Position Sell
Sell stop below 174
Stop loss above 195
Markets retreat on mixed data

US stocks ended lower on Monday as oil prices tumbled while technology stocks outperformed, pulling Nasdaq Composite Index to more than a year high. The dollar strengthened. According to the live dollar index data the ICE US Dollar Index, a measure of the dollar’s value against a basket of six major currencies, rose 0.2% to 95.752. The Dow Jones industrial average lost 0.2% settling at 18404. The S&P 500 slipped 0.1% to 2,170.84 with 3.3% drop in the energy stocks outweighing small gains in health-care and tech stocks. The Nasdaq composite rose 0.4% closing at 5184.20, highest close since July 21, 2015, helped by 1.8% jump in Apple. Market sentiment was undermined by mixed economic data which showed ISM manufacturing index fell to 52.6 in July from 53.2 in June while Markit’s final PMI for July rose to 52.9, compared with 51.3 in previous month. Lower ISM manufacturing index together with an 0.6% decline in construction spending in June added to recent negative data such as disappointing Q2 GDP, spurring concerns US economic recovery may be faltering. Investors will be focusing on earnings reports to gauge the health of corporate sector: so far, about two-thirds of S&P 500 companies have announced quarterly results with 71% beating on earnings and 57% reporting revenues above estimates. Today at 14:30 CET June personal spending and personal consumption expenditures price index will be published in US. The tentative outlook is negative for dollar.
European stocks closed lower on Monday as bank stocks declined on disappointing stress tests. The euro strengthened against the dollar while the Pound edged lower after the decline to 48.2 in Manufacturing PMI for July indicated a sharp contraction in UK manufacturing sector. Disappointing results of stress tests designed to show the impact of a sharp downturn on bank’s capital indicated Italian, Irish and Spanish banks would be hardest hit of the 51 firms tested. UniCredit and Barclays shares lost 9.4% and 2%, respectively, Deutsche shares closed 1.8% lower. Germany’s DAX 30 index slipped 0.1% to 10330.52. France’s CAC 40 fell 0.7% to 4409.17 and UK’s FTSE 100 dropped 0.5% to 6693.95. In other economic news final euro-zone manufacturing PMI for July came in at 52.0, up from a flash estimate of 51.9 after June’s reading of 52.8. Today at 10:30 CET July Construction PMI will be published in UK, the tentative outlook is negative for Pound. At 11:00 CET June Producer Price Index will be released in euro-zone, the tentative outlook is negative for euro.
Asian stocks are retreating today with Australia’s All Ordinaries Index down 0.85% despite the decision by the Reserve Bank of Australia's to cut its benchmark interest rate by 0.25 percentage point to an all-time low of 1.5%, as expected. Trading in Hong Kong was suspended for the day because of the Typhoon Nida, Shanghai Composite Index is 0.27% higher. Nikkei fell 1.47% today after rising for two sessions as yen strengthened with investors waiting for the details of government’s 28 trillion yen ($274 billion) stimulus plan to be announced later in the day. It is expected new direct spending will total only about ¥7.5 trillion over two years, less than the ¥10 trillion package Abe introduced in his first year in office.
Oil futures prices are recovering today after settling sharply lower on concerns about global oversupply of crude and gasoline. US oil futures finished in bear-market territory on Monday with September West Texas Intermediate crude futures falling 3.7% to $40.06, a three-month low. A bear market is defined as a fall of 20% from a recent peak. WTI futures briefly traded below the psychologically important $40 a barrel level before paring losses. The outlook for oil market is bearish as crude oil output is up slightly in the United States and also rising in OPEC-member Iraq.